Sunday, April 18, 2021

Measuring GPS Speed Accuracy

 How do you know how accurate your GPS is? This question once again came up when I started looking into a "plug and play" GPS. Unfortunately, there's no simple answer to this question, so there will be a few posts looking at different aspects.

In search of the answer, the first thing to try is to use two GPS units right next to each other, and compare their speeds. Here is an example where I compared two Motion GPS units in a driving test:

The speeds from one unit are drawn in red, the speeds from the other unit in blue. A lot of times, the speeds are so close that only one color is visible. Here's a zoom-in:
In the selected 10 second region (highlighted in yellow), the two GPS units gave almost identical speeds. For individual points, the speed differences were mostly below 0.1 knots; over the 10-second region, the average speeds were 13.482 and 13.486 knots. That's a rather small difference of 0.004 knots!

But the graph shows that this is not always the case. If we look at the region to the right, the observed differences get much larger:
Here, one GPS reports a 10-second average speed of 19.926 knots, while the other GPS reports 19.664 knots - a difference of 0.262 knots. In the context of a speed competition like the GPS Team Challenge, that's a pretty large difference. One interesting thing to note is that the speeds some times deviate significantly for more than a second; the dip in the red track in the picture above, for example, is about 3 seconds long. This is non-random error: in the 10 Hz data for the graph above, the "dip" extends over almost 30 points, which we'd expect to happen once every billion points by chance. We'll get back to this when we look at estimating the likely error of speed results.

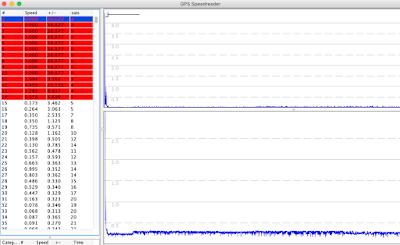
The most straightforward way to compare different GPS units is to compare the results in different top speed categories. Here's a look at some of these, generated using the "Compare files" function in GPS Speedreader:
The table shows the speed results for the two devices, as well as the "two sigma" error estimates in the "+/-" column. The calculation of the result error estimates assumes that the errors are random, so that they would cancel each other out more and more when we look at more points: longer times or longer distances. This leads to higher error estimates for the 2 second results, roughly 2-fold lower estimates for the 10 second results, and very low estimates for the nautical mile (1852 m) and the 1 hour results. About 95 out of 100 times, we expect the "true" speed to be within the range defined by the +/- numbers. Most of the time, we expect the ranges of the two devices to overlap. Only about 1 in 10,000 results would be expect random errors to cause the results to be so different that the ranges do not overlap - which GPS Speedreader highlights by using a red background.

But the table shows that 5 of the 14 results are more different than expected. 5 out of 14, not one in ten thousand! There are three possible (and not mutually exclusive) explanations for this:
  1. One (or both) of the GPS units is not working correctly.
  2. The error in not random, so that the conclusions based on assuming random error are incorrect.
  3. The single-point error estimates that the GPS gives are too optimistic.
Let's have one more look at the data, and this time, include a graph of the single-point error estimates:

We can see that the point error estimates in the regions where the curves diverge are larger, which is a good sign. But do they increase enough? And is the difference that we see due to one GPS being "wrong", or do both of them disagree, and the truth lies somewhere in the middle? To answer these questions, we need more data.

Fortunately, this was a driving test, so getting more data was easy: just put more GPS units on the dash board! So I added a few more: a couple of Locosys units (a GW-52 and a GW-60), a couple of u-blox prototypes that have been approved for use in the GPS Team challenge (a BN880 and a BN280, both Openlog-based), and my current u-blox Neo-M9/Openlog Artemis prototype. That makes a total of 7 GPS units: two with a Locosys Sirf-type GPS unit, and five with a u-blox based design. All units were set to log at 5 Hz for this drive. Here's an overview:
What is immediately apparent is that the error estimates differ a lot more than the speed estimates. In particular, the error estimates from the Locosys units, shown in purple and green, are much higher than the u-blox estimates, except when the car was stationary.

Here is a zoom-in picture:

Most of the GPS units are pretty close together for most of the time, but several units stick out a bit by showing larger and more frequent deviations. But just like in the first and second picture in this post, the details vary quite a bit between different sections of the drive.

So we're back at the question: how can we quantify the error of each of the units, using all the information in the tracks, instead of limiting us to just a few top speeds? 

Along the same lines, what can we learn about the point error estimates ("Speed Dilution of Precision", or SDoP, in Locosys parlance, and "speed accuracy", or sAcc, in u-blox parlance)?

I'll start looking at answers to these questions in my next post.

Wednesday, April 7, 2021

The Milk Jug Experiment

 My last post ended with this graph:

Before I tell you what I did to generate it, let's first look at the "why". Here's a short section from a recent windsurfing session that illustrates the problem:
I compared three different GPS units in this test. At the highlighted section, the three GPS units disagree from each other by roughly 0.5 knots for a few points in a row. Areas like this are easy to find in many GPS traces - but what causes them? The GPS units can be much more accurate that this, as stationary tests show, where typical errors are about 10-fold lower. 

One potential cause of the larger errors are short-term changes in the satellite signals received by the GPS; specifically, changes in the signal and/or noise for one or more satellites, and in which satellites the GPS uses to compute speed and position. So the experiment was to induce controlled changes, without moving the GPS, and see what effect they had on the observed error (the speed, since the GPS was stationary) and the error estimates given by the GPS.

To disturb the signal, I took a one gallon milk jug and filled it with water. I then moved it around the GPS and on top of the GPS, keeping a distance of at least a few centimeters, for about 30 seconds. I did that twice, with 30 second control periods where I kept the jug away before, in between, and after. The periods where I moved the jug around the GPS are highlighted in the first graph.

The speeds that were reported by the GPS because of the distorted satellite signal were around 0.5 knots multiple times, and near 0.8-0.9 knots a few times.  I was a little surprised to see such "speeds" just because the signal was partially blocked - after all, the GPS should still have been able to get a perfectly clean signal from most of the 20-25 satellites it was tracking. But apparently, having just a few signals removed or distorted is sufficient to cause errors in the range that we can often see in windsurf tracks.

Now I don't usually windsurf closely to people waving milk jugs, but it's just an example of a sudden change in the satellite signal cause by external factors. During windsurfing, that could be something as simple as changing the position of the arm that the GPS is on, or the body position, so that a different part of the sky is blocked by the arm or the body. The more things move around, the more likely that is to happen - and if you don't have the luxury of windsurfing at a flat spot like Lake George or La Franqui, chop might just do the moving for you.

In a similar experiment, I looked at what happened when moving the GPS up and down rapidly, and the results looked similar, even when looking at directional speeds (velN and velE). But my lovely wife pointed out that I could not really be sure that I was moving the GPS straight up and down, without side-to-side movement, so this experiment would need to be repeated in a more controlled fashion. For now, I'll just say that it is possible that rapid up-down movements of the GPS, which are typical when sailing in small to medium chop, might also have an effect on GPS accuracy.

One interesting question arises when comparing the results from different GPS units that are very close together, and technically identical (or very similar). They both should "see" the same distorted signal, so why would the not compute exactly the same result?

Rather than answering this question directly, or speculating about why this may not be the case, I'll show a graph from a stationary experiment where I had two identical units positioned very close to each other, with a clear view of the sky:
One interesting result shown in the table above is in the "sats" column, which shows how many satellites each unit tracked. Since the units were very close to each other and technically identical, it is reasonable to expect that they would use exactly the same satellites. But at the start of the highlighted region, one GPS used 17 satellites, while the other used 20 - that's a pretty substantial difference! Here is a graph of the satellites tracked by the two Motion units over a time of about 1000 seconds (starting a few minutes into the test, after both units showed the same number of satellites):
For large parts of the tests, the two GPS units differed in how many satellites they used - which means that blockage or distortions of one or a few satellites could affect the two units differently, thus possibly leading to comparatively large discrepancies in the results.

How does all this relate to speedsurfing, you might ask? The blocking experiment is an example of non-random noise in the data. If you look back at the first graph, you may notice that the error estimates increase much less than the speeds. This means that there are multiple regions where the error estimates are significantly lower than the observed errors for more than 10 points in a row - here is an example:

Statistically, we would expect to see some points where the speed is higher than the error estimates, but we should practically never see this many points where the error is larger than the error estimate in a row - if the error is random. But if the error is not random, then we can not use Gaussian error propagation, which makes collecting at high data rates entirely pointless.


Sunday, April 4, 2021

GPS Noise and Data Rates

I'm noise sensitive, so perhaps it is quite fitting that I spent some time looking at "noise" in GPS units, and the relation between noise and data rates. Between the relatively cold water around Cape Cod and Cape Cod's dubious distinction to be the hot spot for the Brazilian P.1 variant of the COVID virus, on-the-water testing will have to wait a while. So the tests I report here are all stationary tests.

One big advantage about stationary tests is that we know exactly what speed the GPS should report: 0.00. Everything else is an error. As Tom Chalko did with Locosys GPS units many years ago, we can use this to learn about the error characteristics of GPS chips. There's one little caveat about the directionality of speed in speedsurfing, and the non-directionality of measured speed when the actual speed is 0, but we can ignore this for now.

For this series of tests, I am using a Sparkfun Neo M9N GPS chip with an active ceramic antenna (25 x 25 x 2 mm from Geekstory on Amazon). I'm logging either via USB to the a Surface computer, or with the Openlog Artemis I described in my last post. Compared to the M9 chip with the onboard chip antenna I used before, the current combo gets a lot better reception.

Let's start with an utterly boring test, where the GPS had a perfect, unobstructed view of the sky on a sunny day (the GPS was on top of the roof rack on our high roof Nissan NV van):

At the beginning, there's a little bit of speed when I switched the GPS on, and moved it to the top of the van. I had used the GPS just a few minutes earlier, so this was a "hot start" where the GPS very quickly found more than 20 satellites. After that, it recorded a speed close to zero (the graph on top), with an error estimate around 0.3 knots (the lower graph).

Let's switch to a more interesting example. The next test was done inside, over a period of almost 2 hours. The GPS was positioned right next to a wide glass door, so it had a clear view in one direction. Here's the graph:

At three different times, the GPS recorded speeds of more than 1 knot, even though it was not moving at all. With a typical estimated accuracy of about +/- 0.5 knots for each point, that number is actually a bit lower than expected. But what raises some red flags is that each point with a speed above one knot is closely surrounded by several other points that are also much higher than average. This is reflected in the top speeds averaged over 2 and 10 seconds: 0.479 knots and 0.289 knots. In fact, all top 5 speeds over 10 seconds are near or above 0.2 knots.

Let's look at one more test run - this one done at 8 Hz overnight, for about 10 hours:
The GPS was at exactly the same spot for this test. The overall results is similar, with a bunch of spikes between 0.5 and 0.9 knots. The top results for 2 second and 10 second averages are a bit lower, but we still see a couple of 10 second "speeds" of 0.2 knots.

Now wait a minute - I just said that the recording at the 3-fold lower data rate that covered a 5-fold longer observation period had lower observed errors. That is exactly the opposite of what we would expect! At first glance, the errors appear random, or at least mostly random. For random errors, statistic tells us that if we measure more often, the measured error will go down. Going from 25 samples per second down to 8 samples per second should reduce the observed error by about 77% - but that's not what we see!

The explanation for what we see is that the error is not entirely random - in fact, it has a substantial non-random element. That's quite obvious in the 25 Hz graph, where we can see a wave pattern in the error estimates, and clusterings of high speed points when the "error wave" is higher.

To have a closer look at the (non-)randomness of the observed errors, I copied the data from GPS Speedreader into a spreadsheet program, and then shuffled the observed speeds randomly. Next, I looked at all 2 second periods in the shuffled data, and compared the results to the results from the original data set. With completely random data, shuffling should not have an effect - we'd see the same top speeds. But if the original reported speeds (= errors) were not randomly distributed, we should see a difference. Here's a screen shot that shows the results for a test recorded at 18 Hz:


The average 2 second speed is 0.062 knots for the original and the 4 different shuffle tests, as expected. But in the shuffled sets, the maximum observed 2-second speed was between 0.093 and 0.097 knots - more than 3-times lower than in the original data set. Essentially, this proves that the error in the data set was not randomly distributed.

For comparison, here is the same analysis for a test recorded at 5 Hz:

For the 5 Hz data, we also observe a difference, but it is much smaller: the original data had a 2-second maximum that was about 50% higher than the shuffled data sets.

In my next post, I'll look into what's behind the non-randomness of the error. However, I'll leave you with a little puzzle and show the results of one of the tests I did:

Can you figure out what I did here? Here are a few hints: it involved a gallon plastic jug filled with water, and the numbers 2, 3, 5, and 30. Good luck, Sherlock!