I can't wipe the silly grin off my face. What a great day! It was raining. The wind meter readings were at 20 mph for about 20 minutes, and that was after I had left the water. I crashed a lot. My top speed was 17.3 knots, and my distance sailed 14.6 km - both numbers that usually would indicate a terrible day.
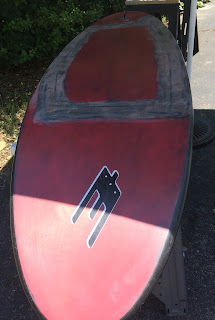
But I was on the foil. I had spend about 8 hours repairing my 71 cm slalom board that had a large-scale delamination on the bottom. Here's a picture of the zombie board in its current state:
Well, the little zombie works a lot better than old Skate 110 or Nina's Bic Nova 170 I've tried before, so I've been foiling every time I got a chance in the last week, even when we got enough wind to plane on regular gear. Here are today's tracks:
It was low tide, so I stuck with the 60 cm mast, which probably limited my upwind angles (at least that's my excuse :-). I spent a lot of time pinching upwind, but I was just barely powered most of the time. That limited the number of jibe attempts to less than a handful, but even in several of these attempts, I was amazed how long the board stayed on the foil and out of the water. Here's a video of one of the attempts:
I was so surprised to still be foiling that I just held on to the mast and waited for things to drop down...
I'm not sure what it is about foiling - the silent flying? The gently touches? The 100% concentration that forces you "into the zone"? The fun of learning something new, and be scared by going about half as fast as when windsurfing? Whatever it is, I love it! So big thanks to Andy Brandt and the ABK Boardsports crew for giving me lots of opportunities to try foiling; Slingshot for sponsoring ABK; and Britt Viehman from North Beach Windsurfing for advice and hooking us up with a great foil.
Amazing Foil Life Podcast Blog Post
1 month ago


