Wednesday, May 31, 2017

Reader Comments about Filters

In response to my post about the "60 Knot New Speedrecord", a reader had a bunch of comments. I answered the first comment in the comment section of the original post, but he came back with a whole bunch more. Mathew wrote:
"Thanks for writing up a follow up. It should be pointed out that the acceleration filter shouldn't "per point" as highlighted in the follow-up... it should apply from last-good-point until the next point which doesn't breach the threshold. Also - and this example highlights it - once a filter has been breached in the middle of a run, the remainder of the run must be discarded [ most of the time ]. The problem here isn't that we dont understand what type of filtering is required - we already do know -> the problem is that the auto-filtering of the software analysis, doesn't match how humans do it. ie: if your data isn't clear, then then the data from that run shouldn't be used. [ Which is why we use two, three or four GPS's.... ] ... In the RealSpeed example, with 3ms-2 (5.5 kns-2) it takes about 3 seconds for the threshold to not be exceeded [ (20.8-4.5) / 5.5]. Since a new threshold is breached within 3 second window, the new window needs to be calculated... and so on. Thus about 7 seconds or so should be dropped.
A standard practice in all sciences, is to drop data that is completely bogus -> thus all "simple filtering" should be applied first, then apply SDoP filters last. [ Caveat: big-data analysis doesn't work this way generally speaking, as the algorithms are sometimes more accurate using bogus data. ] It would be useful to implement the filters accurately, then apply it to these examples vs. applying a simple SDoP filter.
... the point is -> SDoP/SDoS isn't a panacea - it doesn't replace simple physical constraints of the sport. Indeed humans naturally apply a few more physical constraints, ie: even though 3ms-2 is the threshold, it is completely unlikely to that you will sustain 1/3G acceleration for more than a few seconds simply because the drag component goes up very quickly [ vs terminal velocity of about 30m/s ]. "

This is pretty long, so let me just restate what I think he is saying in simple terms:
  1. We know that acceleration in speedsurfing is limited to less than 5.5 knots/second
  2. When looking at GPS tracks, that allows us to identify artifacts without any doubt. If the speed shoots up from 5 knots to 20 knots between 2 data points, we know something is wrong.
  3. If software could implement this "physical constraint" in filters, that would allow the identification of artifacts without SDoP filters.
  4. However, just throwing out single points where the acceleration is above the threshold is not good enough (as I had illustrated in response to his previous comment).
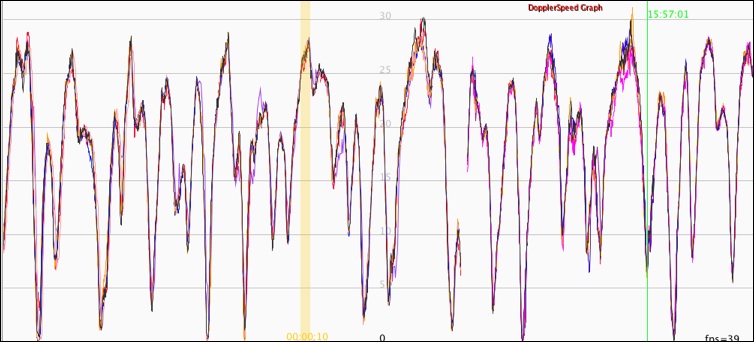
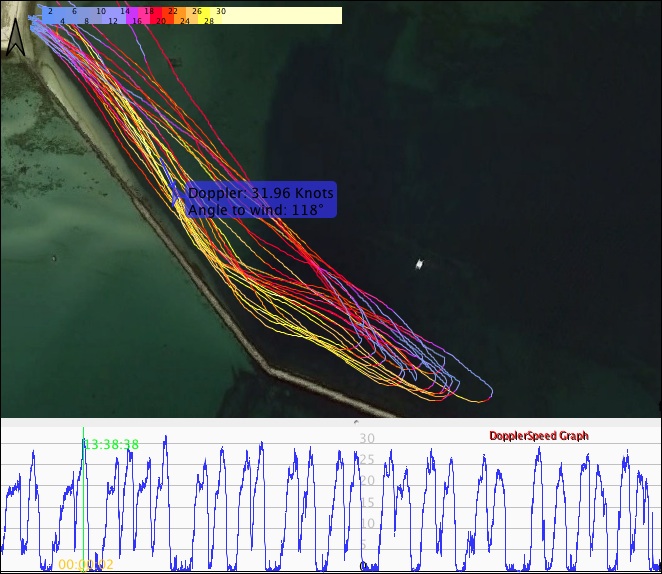
Before I go into a detailed analysis about these points, let me say that I mostly agree with Mathew. For example, the typical acceleration in speed runs is less than 2 knots per second. For example, check out one of Boro's recent traces where he got close to 40 knots:
Let's zoom in on the speed run in the middle:
I selected the region where the acceleration was highest, or close to it. Within about 4 seconds, he went from 31 knots to 36 knots - that's an acceleration of about 1.25 knots/second. So if we accept that this is a typical track, then a threshold of 5.5 knots/second seems rather safe. But is it?

Let's look at what the current default in the most accurate GPS analysis software is, GPSResults. For 5 Hz GPS data, the acceleration filter defaults to 8 m/second(squared) - that's 15.55 knot. That's about three times as high as what we said! Why does GPSResults not use the 3 m/s2 that Mathew suggests?

Well, theories are all nice and good, but it's always better to look at real data. I went through a test set of about 200 GPS files from GW-60 watches and GW-52 units to see how many of these files had points with an acceleration above 3 m/s2. The answer: 125 of 197. That's about 2 out of every 3 files! If we'd implement a filter with this threshold, it would remove good runs from the majority of files.

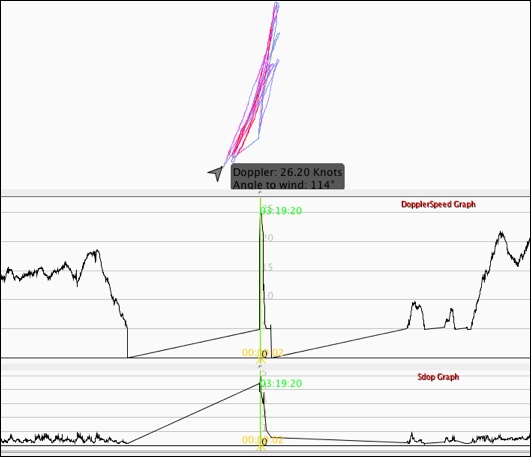
So what threshold would work? In the test set, the highest acceleration within the top five 10-second runs was 6.35 m/s2. If you're wondering what the data look like, here's a screen shot from my analysis software:
At the second point in the table, the doppler speed jumped from 25.562 knots to 28.03 knots - that's about 2.5 knots faster in 0.2 seconds! Looking at the track, the spike is quite obvious. It looks like random noise added on top of a much smaller real acceleration; in the next data points, the speed goes down again. Overall, though, this run looks good - there's no reason to discard it.

So even for this small set, we'd need a threshold close to 7. If we'd look at more test data, we'd probably find a few tracks with even higher numbers, so the threshold of 8.0 that GPSResults uses for 5 Hz data seems quite reasonable. Unfortunately, having to use a higher threshold throws off Mathew's argument a bit. 

The higher threshold is needed because the higher frequency data from the GW-60 and GW-52 devices has a lot more noise. That's not a problem - since we have a lot more data points, we can average out the noise. But trying to implement this in a filter will be quite a bit more complicated than it seems at first glance.

If we examine the current versions of 4 different programs to analyze GPS data (GPSResults, GPS Action Replay Pro, ka72.com, and RealSpeed), it appears that only one of the four has a reasonably implementation all filters that are known to work, and uses them by default when calculating speeds (I am talking about HDoP, SDoP, minimum number of satellites, and acceleration filters). Three out of the four programs are missing one or more of these filters, and/or require a separate manual step to apply them. This is for very straightforward filters: "if the value is above (or below) the threshold, mark the point as bad, and do not use it to calculate speeds". It would be a great improvement to see these simple known filters implemented in all four GPS analysis programs.

But even the most accurate program, GPSResults, currently fails to identify some artifacts that can occur when the data quality is marginal (but not obviously bad).  For this particular problem, better filters would be needed - for example filters that use average SDoP errors for short-term speed (or standard error estimates, which also consider all error estimates in a region, not just single points). For errors that result from "dead reckoning"-type overstatements, acceleration filters would not help at all - the very cause of the error is that the software inside the GPS tries to keep speed relative constant when the GPS signal is bad. So far, though, the level of interest in implementing better filters for such artifacts seems darn close to zero.

Let me finish with a comment on Mathew's pointers towards scientific and "big data" analysis. There are some interesting similarities between large-scale DNA sequence analysis and GPS analysis. I worked in large scale DNA sequencing at the beginning of the Human Genome Project (HGP), when the data were analyzed very much like GPS data are still analyzed for records: with some computer help, but also a lot of human checks at any problem regions. During the first years of the project, progress was very slow, and many scientists doubted that the project would finish on time. The first big breakthrough came when someone developed accurate "quality scores" - a measure how likely the sequence data points were to be correct, which is very similar to SDoP values. As soon as these quality scores were widely used, many analysis bottle necks were removed; the accuracy of the "final" results increased dramatically; and throughput jumped. The quality scores were one essential part that enabled further dramatic improvements which allowed the Human Genome Project to finish ahead of its deadline. Early on, I did a little bit of research to evaluate both the accuracy and the usefulness of the "SDoP-equivalent"; the results surprised me positively on both counts. 

In the early phases of the HGP, we did something that is very similar to the wearing of "2, 3, or 4" GPS units that Mathew mentioned - we'd also generate data several times over. We had lots of complex rules and highly educates scientists to check on any discrepancies; but in the end, we ended up with "finished" data that had orders of magnitude more errors that what late could be done completely automatically, using accuracy estimates (and proper filters and analysis algorithms).

So yes, I may be somewhat biased towards seeing the usefulness of accurate error estimates.

Saturday, May 27, 2017

Overstating Speed by 4 Knots

This is a geeks only post. You've been warned.

I love my GW-60 GPS watch, and it has worked great for me. However, recent problems with accuracy that both Boro and Denis on our team had seen made me wonder how often such issues arise. I had never seen them in my data, and I often looked closely enough that I would discover them. But many speedsurfers just quickly analyze the data to get their speeds, and upload those speeds, trusting whatever the software tells them.

So I went on a little fishing expedition on ka72.com. I searched for downloadable GPS sessions from May 15, 2017 onwards, and downloaded data files that were from GW-60 watches. Then, I looked at the tracks in detail in GPS Action Replay Pro and GPSResults, searching for examples where the 2 second speed was overstated.

After checking 15 files, I found one with a problem:  the top speed was just a few seconds of 25-knot speeds, in the middle of what looked like a longer swim. That's not how top speeds are reached! Sure enough, the GPS analysis software came to different results: Ka72.com and GPSResults gave a top speed of 25.3 knots, but GPSResults gave only 21.37 knots - 4 knots less! Let's look at the data:
This windsurfer had set up his watch to record only if the minimum speed exceeded 5 knots. The middle graph shows the speed: it was below 5 knots for about 4 minutes, with a few seconds where he supposedly sailed a lot faster than during the test of his session. The tracks on top show that this was at the very end of a run, after turning around - very suspicious! The accuracy graph at the bottom confirms the suspicions: the watch new that it did not have good data, and gave the data near the spike a much higher error estimate than the test of the track. Which, by the way, is why GPSResults did not include this region when it looked for top speeds.

Here are the data points in this region:
All data points in this regions have +- numbers between 3.2 and 4.957 - in other words, they are junk and should be ignored. For this screen shot, I forced GPSResults to behave badly by turning the filters off. The two other analysis programs, GPS Action Replay and ka72.com, always behave badly with data like this - they do not have SDoP filters.

In both this and the previous example of speed artifacts, the errors occurred during prolonged times where the windsurfer apparently was in the water, probably swimming, trying to waterstart, or resting. In such situations, GPS watches are more prone to artifacts because of where they are typically worn: on the wrist (instead of on the upper arm or helmet like other GPS devices). That means the watch will be under water much more than a GT-31 or GW-52 GPS, not getting any GPS reception because water absorbs the GPS signal. But at times, the watch may be close to or just above the water, and get a signal for a short time. At that point, the GPS chip has to re-acquire the satellites, and calculate the current position from scratch - which can introduce big errors, especially if the reception is marginal. In the tracks and the non-doppler speed graphs, there are often big jumps and spikes when this happens. Usually, that's not a problem with doppler speeds (which is exactly why we use doppler speeds for GPS speedsurfing!): single speed spikes from position adjustments just disappear in the doppler speeds. But when swimming with the watch close to the surface, we sometime see multiple spikes in the speed graphs. When that happens, the error can "go through" to the calculated doppler speeds, which is what we see in the graphs above.

Many speedsurfers may never see issues like this one because they sail in shallow locations, nail their jibes, and/or waterstart quickly very time they crash. But if you have a session where you spend a considerable amount of time in the water, then the chances of errors like the one described here are significant. Sometimes, it's obvious - Denis knew he had not set a new world record. Other times, it's not; in the example above, the 2 second speed seems reasonably close to the 10 second speeds, at least at first glance, so the result was posted to the GPS Team Challenge. In this case, it did not affect anything; but similar problems could happen during faster sessions that count for the monthly ranking.

While this particular problem here may be specific to GPS watches, and maybe even the GW-60 watch, I have seen similar artifacts in GPS data from all kinds of devices, including the long-time "gold standard" GT-31. Typically, it's easy to recognize such problems if you look at the your GPS traces, and examine your doppler speed graphs for the top speeds. In GPS Action Replay, I also find the "SDoP" graph quite useful to identify problem areas. I don't find GPSResults quite as intuitive, but then, GPSResults does a much better job at filtering out problem areas automatically, so the results are more likely to be accurate in the first place. Hopefully, we'll also see similar automatic filtering soon on ka72.com and in GPS Action Replay Pro.

Thursday, May 25, 2017

60 Knots - A New Speedrecord?

Short answer: no. Before I get to the long answer, let me warn you: this is another one of my geeky posts. I reckon it may be of interest to about 5 or 10 windsurfers in the whole world! You've been warned.

This all started when our "United Speedsailors of America" team member Denis posted results from a recent session. He had uploaded his results to ka72.com, and it showed that he had reached 2 second speed of 59.88 knots:
Denis does around 40 knots on a regular basis, so he is wicked fast. But he also knew that he definitely had not broken the world record for 2 second top speed (55.23 knots by Antoine Albeau on the Lüderitz Speed Channel). Even the ka72 results hinted in that direction: his best 10 second speed was just 30.1 knots.
Furthermore, Denis often sails with Boro, who just recently had his own problems with GPS accuracy,  so he was very skeptical about what his watch tried to tell him. He had also worn his old trusted GT-31 GPS unit, and that had reported a top speed of only around 30 knots.
World-famous speed surfer and GPS guru Roo (yes, he is from Australia!) immediately looked at the tracks, noticed that during the time of the supposed record speeds the "sat count dropped to 6/7", and came to the conclusion that due to "the surrounding mountains the sats that were just above the horizon produced poor signals which caused the anomoly".

Well, this seems to make sense - Denis and Boro are windsurfing on a mountain lake, so the mountains around it must be too high! Since almost everyone else is windsurfing in flat terrain, maybe we can just ignore their problems? That's simple! Simple is great! Right?

Not so fast, cowboy! Sure, there are 10,000 ft (3,000 m) mountains around Washoe Lake. But the lake itself is at 5000 ft elevation, measures 2 x 4 km, and is in a valley that extends more than 10 km from each end of the lake. So a lot of the sky and the GPS satellites will be visible. So let's look at the tracks:

The doppler speed graph from his GW-60 watch is shown on the top in red; for comparison, the GT-31 data are shown in blue at the bottom. The GW-60 data show 3 spikes: 2 above 50 knots, and one above 70 knots! Before we jump to any hasty conclusions, let's zoom in on the largest spike:


We can see that the blue (GT-31) graph shows a speed close to zero around the time of the spike. In other words, Denis was most likely in the water at that time. There are few things that kill GPS reception as well as a few inches of water! We can also bet that Denis wore his watch on his wrist, and the GT-31 on his upper arm, so at times, the watch will have been deeper under water. Sure, the watch should not show a spike like this .. but I have seen similar spikes in GT-31 data in the past (and do not usually see them in GW-60 data, even when I fall a lot). As Forest Gump said: "It happens".

But let's not stop there - let's look at the actual data points:
Pay attention to the "+/-" column, which shows error estimates for the speed (also called "SDoP", for "Speed Dilution of Precision"). The SDoP values start at around 2, but then quickly jump up to 4.957, which is where they stay for a while. At the first line of the highlighted area, we can also notice that the time between data points jumped from 0.2 seconds to 16.6 seconds - for more than 16 seconds, the GPS did not have enough reception to calculate speed. Denis, where was your hand?

If you wondered why the +/- numbers never got higher than 4.957, give yourself a geek gold star! That's simply because the SDoP numbers are stored as a single byte in the .sbp files, and the highest number possible corresponds to 4.957 knots. In plain English, an SDoP of 4 or higher indicates complete junk.

So, the watch actually knows that these data points are junk! Any analysis software should now, too! As guru Roo correctlu pointed out, GPSResults completely ignores the problematic data points, and gives top speed results that are practically identical to the results from the GT-31 unit. GPSResults has an SDoP filter, and by default refuses to include any regions with SDoP values above 3.0 (for 5 Hz data). The big question remains: what about other software?

Many Australian speed surfers analyze their results on ka72.com, and Denis did. However, it appears that ka72.com either does not use SDoP filters, or does not use them correctly. If we assume that Denis' problem had more to do with putting the watch under water than with being surrounded by mountains (which was not a problem when he was not swimming), then this problem might affect many other speed surfers, and needs to be addressed (there's also a problem with the alpha 500 numbers being wrong for this track).

Now, how about my favorite GPS analysis software, GPS Action Replay Pro (GPSAR, which I used to create all the screen shots above)? Unfortunately, the results are not pretty:
GPSAR calculates a top speed of 64.55 knots! Based on the settings shown in the speed dialog, GPSAR does not have any SDoP filtering at all, and thus arrives at incorrect results.

So, here's the bottom line:
  • Accuracy estimates are fantastic to automatically identify bad data can lead to very large over-estimates - even fake "world records"
  • ka72.com and GPS Action Replay Pro do not appear to have functioning SDoP filters at this point in time; any data analyzed with either software should be carefully checked!
  • GPSResults has SDoP filters that can correctly identify artifacts such as the ones described here; however, as I have shown in a previous blog entry, the default settings may not be adequate to catch smaller errors, which can overstate speeds by a knot or two
--
As mentioned above, Denis's data files are available on ka72.com. I also made zip files with the data from my previous post about GW-60 accuracy for Boro's data and for the 6-GPS test drive.
--
Added May 28, 2017:
In a comment to this post made today, Mathew made the bold statement "You dont need SDoP - just have a sensible acceleration filter". Well, acceleration filter can indeed be helpful to identify some problems, but they can not identify all problems that SDoP filters can find. The program GPS Action Replay does have an acceleration filter, but using it (which is an extra step that most users won't do) does not fix the problem. Applying a 3 m/s2 acceleration filter in the current version of GPSAction Replay (5.23) removed 801 points from Denis' track:
But afterwards, the speed table still shows a top 2 second speed that is 17 knots to high:
That's a little better than the 64.55 knots before the filter, but still wrong. Perhaps this is a bug in GPS Action Replay that could be fixed - but acceleration filters can, by definition, only identify some artifacts: those with too much acceleration. In case of artifacts that remain high for a few seconds, acceleration filters will fail. Here's an example, using RealSpeed and the problem trace I described in my next post:
Here, the speed increases from less than 1 knot to 20.5 knots in 0.2 seconds, and then to 24.7 knots. After that, the speed remains around 23-25 knots for more than 2 seconds. The acceleration filter identifies the first 2 points, and also a few points at the end of the artifact (shown in red); but the points in the middle have low acceleration and look fine to the filter, which is why they are shown in green. Even after applying the acceleration filter, this data set still gives a 2 second "top speed" that is from an artifact, and 4 knots higher than the real top speed in this track. But the SDoP values in this region, which are all above 3, make it very clear that the data cannot be trusted and should be discarded.

Another example of errors which acceleration filters cannot catch, but SDoP filter can, are the more subtle 1-2 knot errors that can result from using an underhand grip in speed runs, with the watch facing downward and the lower arm blocking the GPS signal. It remains to be seen, however, what the best thresholds and implementation details for SDoP filters are that can catch such artifacts, without throwing out "good" data where just a single data point has higher-than-usual error values. That requires looking at a bunch of GPS files in detail to see how to separate the good from the bad, and will take a while.

Wednesday, May 24, 2017

Lightning in my Harbor

Lightning is the only thing that gets windsurfers off the water. But sometimes, Lightning may be the only thing that gets windsurfers on the water. Obviously, I'm talking about two different things.

The thing that got me on the water today is shown in this picture:
It's an F2 Lightning from 1987. I got it a few months back for $100. What a steal! Of course, it needed some work - a few little holes needed patching; the footstraps were falling apart and needed to be taken off; the mast track needed an hour of my attention before I figured out how to make it work again; and the daggerboard gasket needed to be replaced (with a few layers of sail repair tape for now). The picture above is from its brief maiden voyage at Fogland last week. Since then, I started to work on putting some footstraps on, and got the mast track working again, so I was dying to test it. When the Chapin wind meter showed averages around 14 mph today, with gusts to 17, I just had to go! The GPS tracks tell the story:
For comparison, here are tracks from an earlier session on a 117 l slalom board with the same sail:
The slalom session had quite a bit more wind (gusts up to 24 mph), but the tracks are more the typical back-and-forth session (I had to use a weed fin, which did not help). In comparison, going upwind on the F2 Lightning was not only 10 times easier, it also was a lot more fun - the longboard railed up very nicely! I played around with the upwind stance Andy Brandt had shown me last year - front foot sideways on the daggerboard knob, with the lower leg lying on the board, and the body far out over the water - that worked amazingly well! The top speed on the Lightning also was quite good - almost 24 mph, compared to 28 mph on the slalom board - but again, gusts were 7 mph on the slalom day! It really helped that going upwind on the longboard was so wicked easy; that made long, deep downwind runs easy, too. But the biggest difference was when the wind dropped down to 12 mph during the last third of the session. On the slalom board, that would have meant boredom and pain - there's simply no fun to be had on slalom gear unless it's planing. The Lightning, in contrast, was still fun, slowing down proportionally to the wind strength, instead of dropping suddenly from 20 mph to 6 mph as the slalom board would have done. The $100 I spent for the F2 Lightning were the best $100 I ever spent on windsurf gear!
Some of the readers with excellent memory may remember the title of this post, and wonder why I called Barnstable Harbor "my harbor". Well, that's simple: I had it all for myself! There were a couple of fishing boats out - maybe one every few of square miles. But otherwise, the harbor was all mine - as it is most of the time when I windsurf there. Not that I'd mind sharing - it's big enough, and one of my all-time favorite windsurfing places!

Monday, May 15, 2017

The Fastest Way To Get Faster

Some people who saw me driving around today looked at me in a funny way. Was it because I had my arm out of the window in 54ºF (12ºC)? Or maybe because I had 6 GPS units strapped to my arm?
In case you're wondering: I was wearing two yellow GW-52 units on top; two GW-60 PGS watches on the wrist, one facing up and one facing down; and a GT-31 plus a third GW-52 at the bottom.

As fascinated as I am with GPS speedsurfing, even I need a good reason to strap more than $1000 in GPS devices on my arm and go for a drive. I had one! I wanted to reproduce what Boro had accomplished recently. Boro wanted to start using his GW-60 watch, and compared it to his trusty old GT-31 GPS units. He got substantially higher speeds from the GW-60 watch:
  • 2 seconds:
    37.99 knots GW-60, 36.29 knots GT-31
  • 5x10 seconds:
    33.71 knots GW-60, 33.20 knots GT-31
That's 1.7 knots more for 2 seconds! It takes me (and others) years to improve my speed by that much! In many other tests, the speed of the watch had been much closer to the speed of other GPS units - was his watch broken, or was there another cause?

Looking at Boro's GPS files, it was obvious that his speed data had unusually high error margins of +- 1 to 2 knots; that's at least 2 times higher than usually, and about 5 times higher than what can be achieved with good GPS satellite reception. The error margins were about 2x higher when he was going the direction of his speed runs than when he was sailing back.

The first suspicion was that he was using an undergrip, with his watch hand closer to the mast, on his speed runs, and Boro quickly confirmed that this had indeed been the case. The human body is a very good absorber of GPS signals, and the GPS gurus had been very concerned about this very scenario - watches faces down towards the water, with an arm between them and the GPS satellites. I quickly did a little test walk with a couple of GW-60 watches on my wrist, one facing up and one down, and was able to reproduce the roughly 2-fold increase in error estimates if the watch is facing down.

But could such an increase in speed errors cause the observed difference in speed? There are some theoretical arguments against that: if the error is random, and we collect data at 5 Hz, we get 10 data points for 2 seconds, and 50 for 10 second runs. Average error should sometimes go up, sometimes go down, so that the total error should go down the more points we have. With 10 points, we'd expect the error to go down about 3-fold; with 50 points, about 7-fold. With data like Boro's that have about 1.5 knots error estimates, the expected error for 2 seconds is just 0.5 knots; for 10 seconds, it's closer to 0.2 knots; for 5x10 seconds, even lower.

So, something just is not right here. Instead of boring you to death with more theory and statistics, let's get back to my little drive. The idea was simple: let's just see what actually happens if we go for a drive with a bunch of GPS units, some facing up towards the satellite, some facing down. Somewhere in the middle of the drive, turn the arm around by 180 degrees and see what happens! And, most importantly - what's the effect on the top speed?

Let's start with a look at the speeds:
This is about 15 minutes worth of data from 6 GPS units - a bit too much information to see much. I deleted a few data points in the middle, where I turned my arm around. I also split the tracks into 2 segments for each device, before and after I turned the arm. So each device was pointing up for one segment, and down for the other.

Let's jump straight to the 2 second speed results from the first segment:
Four units show top speeds close to 28 knots: all the units that were facing up, and the GT-31. But the GW-60 watch and the GW-52 unit that were facing down show speeds that are almost one respectively 2 knots higher! Let's look at the data in detail:

The top graph shows the doppler speed, the bottom graph shows the error estimates. What stands out is:
  • Two speed curves are substantially higher than the others: the black (GW-52 #3) and the red (GW-60 #2). 
  • The same two GPS units have error estimates in this region that are about 2x higher than the other units,
  • The observed error is not random. Both the red and black speed curves stay about 2 knots above the other curves for 8-10 seconds (40-50 data points). If the error would be completely random, this would be extremely unlikely to happen by chance; winning the jackpot in a lottery is more likely.
I can only speculate why the error becomes non-random at high SDOP values, but there's a likely guess: when the signal quality gets too low, the firmware starts to rely more on "dead reckoning". GPS chips sometimes use dead reckoning when no GPS signal is available, for example in tunnels. A sensible firmware implementation would start using increasing amounts of dead reckoning as the signal quality decreases, rather than a single "all-or-nothing" threshold. There are several indications that something like dead reckoning is causing the observed error characteristics, but that probably deserves another post.

Another question that arose was whether the problems are specific to the GW-60 watch, since it apparently has a GPS antenna that is smaller than the antenna in the GT-31, and thus possibly inferior. Let's look at the error estimate graphs from the "up" and "down" segments to get an idea. I color-coded the graphs so that blue indicates "up", and red indicates "down". Here's the GW-60 watch:
The SDOP values roughly doubled when I turned my arm so that the GPS was facing down. Here's the same graph for a GW-52:
Pretty similar, again with a marked increase when the GPS unit was faces down under my lower arm. Finally, let's look at the GT-31:
The GT-31 was facing down during the first segment, and up in the second segment. Again, we see much better data accuracy with the GPS facing up towards the satellites. Note that I sometimes had to take my hand into the car to turn, and that I may not always have had the arm oriented perfectly up or down, but the overall trend is clear: all three devices show the same trend towards much degraded accuracy of the GPS is worn facing to the ground.

Here are some conclusions and suggestions from this analysis (some of these points just re-iterate what others have stated many time before):
  • When using a GPS watch, make sure that the watch is facing up during your speed runs! If you use an undergrip on your front hand, wear the watch on the inside or (even better) on your back hand. Or get an armband extended and wear the watch around your bizeps - it will get better reception there. For the best GPS reception and the most accurate data, consider mounting it on your helmet (if you wear one).
  • The GPS analysis software may need to be modified to deal with poor quality data better. For example, the default SDOP cutoff of 3.0 that GPSResults uses for 5 Hz data seems too high, as the example above and Boro's initial experience show.
  • While the examples I have shown here focus on speed over-estimates, it's just as possible that the error goes the other direction, and the speed is under-estimated. Here's an example:
The red track is from a downward-facing watch, and the speed happens to be several knots too low just around the maximum speed for this region. So wearing the watch facing downward during speed runs may not just be the quickest way to pick up a knot or two - it may also be the quickest way to loose a knot. So - keep it up!

Monday, May 8, 2017

Fun With Eddie's Pictures

We had a couple of nice windsurf sessions at the "Kennedy Slicks" in Hyannis Port Harbor yesterday and today. Eddie took some pictures both days - yesterday from Hyannis Port, today from Kalmus, about a mile away. Here is a picture from yesterday:
I'm about 200 feet away from the pier in this picture. The wind had dropped a bit when the picture was taken, so I'm hanging really low. I had wanted to stop a few minutes earlier, but went out again when I saw that Eddie was just setting up to take pictures.

For comparison, here is the picture from today:
In this picture, either I have shrunken a lot since yesterday, or the wall is noticeably taller. Some shrinking happened - I was on a 7.0 today and a 7.8 yesterday, so the mast length was about 460 cm compared to 480. But mostly, the wall was taller.

Some of you may think I'm telling stories. Some may grow concerned about walls in the water suddenly growing. Some may astutely observe it's not the same section of wall in the two pictures. But those of you who have windsurfed at the Kennedy Slicks will remember that the spot is quite tide dependent. We don't have a lot of tide in the Nantucket Sound - the different between high and low tide today was only about 3 feet. According to the the tide tables, the tide was about 1 to 1.5 ft lower when today's picture was taken.

Since we've got the pictures, know the mast lengths, and have too much time on our hands, we can calculate the height of the wall above the water. Yesterday, it was about 140 cm; today, it was a bit above 200 cm. Most of the difference was from lower tide levels; the remainder could be from some small differences in height between the different sections, or from slight chances in wind direction that pushed more water towards shore yesterday compared to today (it was SSW-SW yesterday, compared to WSW-SW today).

Why does it matter, you ask? Well, thanks for asking! You just gave me an excuse to post today's GPS tracks:
I got my top speed of the day in the second run. All top 5 speeds were in the first 30 minutes; after that, I could not break 30 knots again, no matter how hard I tried. But the readings from the nearby iWindsurf meter show that the wind actually was a knot or two stronger in the second half of the session. So I should have been able to go faster after the first 30 minutes!

From the beginning to the end of the session, the tide dropped by about 0.8 ft, according to these tide graphs. That's not a lot, but it made quite a difference in the wind quality close to the wall - the wind became a lot gustier and weaker, at least in the really flat section within a 100 or 200 feet of the pier. Nina, who was freestyling and playing with waves, verified that this was a localized effect - when she sailed away further from the wall, the wind became steadier and stronger.

That a higher wall due to a lower tide will impede the wind more is not exactly rocket science, but what surprised me was that even a change of less than one foot made such a noticeable difference. When I stopped sailing, the predicted tide level was at 1.55 ft. At more than 2 feet, the wind gets a lot steadier; at 2.5 ft or higher, the disturbances from the wall are quite small, even when sailing within 150 ft of the wall. The higher tide levels come with a slight drawback: a lot of water can gush through the big holes that are in the first third of the wall close to shore, which creates "general unrest" in the water in the near-shore section. But then, I need to practice speedsurfing in chop, so I'll borrow a quote from Coach Ned: "It's all good".

Friday, May 5, 2017

May May Be Good

Some will probably say I'm jinxing it. My answer? Listen to the great Stevie Wonder! Superstition ain't the way! So I'll just say it: May may be good.
The start has been very good - we have windsurfed 3 of the first 5 days. My kind of sailing, too: flat water! We started at Kalmus twice, but I escaped the bumps by sailing to the Kennedy Slicks one day, and to Egg Island the other day. Why, you ask? Check out this short movie from the Egg Island day:

There are very few things I like more than going full speed into a jibe on perfectly flat water. Amazingly enough, I'm still improving my jibes, even after tens of thousands of tries. Yes, that's right - tens of thousands. A good windsurf session has 50 to more than 100 jibes. Multiply that with 150 sessions per year. Repeat for a decade or three, and you might discover the actual number may be larger than 100,000. Do you need any further proof that I'm a slow learner? But it's fun!

The major thing I have been focusing on recently was to switch the feet as soon as the clew moves forward. It's only six years ago Matt Pritchard told me I should do: "imagine a line connecting your foot and the clew - when the clew moves, your foot moves". In my defense, I have been playing around with not switching the feet at all during the jibe as a way to get into switch stance. That's fun, but not the best way to cure "slow feet". Even in the first jibe in the video above, which is pretty decent, I'm still stepping just a little bit too late. But as the Beatles said - "it's getting better all the time".

The thing that made the recent flat water excursion real fun was that Nina joined me every time. When I sailed up to the Kennedy Slicks, she just followed. That confused the wind a bit, so it dropped soon after. But the next time at Kalmus, it was actually Nina who suggested that we'd sail to Egg Island. Twist my arm!  I got so excited that I did not even think of switching back to my slalom board that was on the beach, because the typical WSW bumps were a bit too large for this wannabe slalom sailor.

Today had some strong wind in the forecast - easterlies in the mid-20s. The rain that easterlies always brings even held of until after noon, so we set out early. After checking out West Dennis and finding it (a) empty and (b) not looking attractive at all, we drove back to East Bay. Nina almost jumped out of the van when we drove close to our home - a mix of temperatures near 50ºF (10ºC), no sun, and previous bad experiences at East Bay had reduced her motivation to windsurf today to almost zero. But somehow, we both ended up at East Bay, where not a single white cap was to be seen inside the bay. But there were some on the ocean, so we decided to rig, anyway - 6.0 for Nina and 7.8 for me, with 99 l and 117 l slalom boards.

To cut a long story (semi-)short, we had a blast. The wind started out good and got better. The water was flat in the middle, and near shore even flatter. So what if it started raining towards the end? We were getting tired, anyway. Thanks to the perfect conditions for laying down jibes, both Nina and I ended up with new personal bests for alpha 500 (that's a 500 m run with a jibe in the middle). Nice!

For the curious, here are my GPS tracks from today: