Thursday, November 29, 2018

That's Why

Some of my readers might have been wondering why I want to go to Australia to speedsail in very weedy water. Well, it was windy in Western Australia yesterday, and the speedsurfers around Perth made a very good argument for visiting! Some highlights:

  • 26 speedsurfers from 3 teams posting sessions on GPSTC
  • 19 new personal bests
  • Top speed 41.6 knots
  • 19 sailors posting 2 second top speeds above 34 knots (9 above 36 knots, 3 above 40)
  • A 38.7 knot nautical mile, with 3 posts above 35 knots 
  • 8 alpha 500s above 24 knots, including 2 above 26 knots
Conditions must have been fantastic - 5 of the windsurfers sailed more than 100 km. The sail sizes used were mostly in the 5.8 - 7.0 meter range, with 6.2 m the most common size. Since most of these guys are "recreational" speedsurfers, it's safe to assume the wind was strong, but not extreme. The closest wind meter I could find (in Rockingham) showed wind averages of about 30 knots:
Most of this happened in Mandurah Bay, about 60 km south of Perth, WA. Here's another video from this spot:


Tuesday, November 27, 2018

The Shaking Is Real

I got a few runs today at the Kennedy Slicks before the wind turned too westerly. Here are GPS speeds from on run:
The red line shows the acceleration (the difference in speed from point to point). It's noisy! It all that shaking real? Well, I might have given the answer away in the title, but I owe you an explanation.

First the parts of the graph: it starts with a short break, then some walking into the water, some slogging, sailing through choppy water at about 22 knots, then in smooth water right next to the pier at 28-30 knots. A jibe is next, then back to the the start, pinching upwind. Note that the biggest acceleration changes are in the choppy approach to the wall.

I had my phone right below the GPS in an armband, and recording the acceleration data (at 10 Hz, just like the speed above):
This is a bit more confusing since we measure the three dimensions separately, and the phone changes orientation. But note that the overall pattern is quite similar to that from the GPS! Here are a couple of zooms:

I also had a GPS on the head, here's a comparison of the jibe region:
Note that we get a larger acceleration with the GPS on the arm - that right when I flipped the sail! The arm went forward first, reducing measured speed, and then back, increasing measure speed. The GPS picked that up nicely! The accelerometer peak at this region confirms that this is a real movement.
The head GPS has a smaller acceleration at this spot, but it's still above the 8 m/s2 filter threshold in GPSResults. With default settings, GPSResults would not give me an alpha for this run! Silly. If we measure at higher resolution, filters need to be adjusted accordingly!


Friday, November 23, 2018

Lanes Through Weeds

Weeds and speedsurfing? Yes! Check this video from Fangy's Weed Farm down under:


Only a few more weeks, and we'll be there, desperately trying to find the lanes. The promise of 37 knots in 20-25 knots of wind certainly makes spending a day or two on a plane worthwhile!

Sunday, November 18, 2018

Accelerometer Fun

If the image above makes you curious, keep reading. Otherwise, stop now! This is a slightly geeky and (for most windsurfers) irrelevant post.

In recent discussions about GPS prototypes, some issues about acceleration arose. Current GPS analysis software has "acceleration filters" that aim to automatically identify artifacts by looking at the speed change from one point to the next. We know how fast we usually accelerate on windsurfers - something like 1-2 knots per second is typical. Much more than that, and it's probably an artifact (or perhaps a humongous catapult). Points with high acceleration are excluded from further analysis.

For 1 Hz data from the good old GT-31 GPS units, a threshold of 4 meters per second squared (4 m/s2) worked well. For the newer 5 Hz units, GPSResults automatically raises the threshold to 8 m/s2.  However, when analyzing 10 Hz data from prototype GPS units, we often noted discrepancies to 5 Hz units, especially in the nautical mile runs, and often tracked the acceleration filter down as the culprit: if a single data point in the middle of a nautical mile run had an acceleration above 8.0 m/s2, then the entire run would go missing, since runs cannot contain filtered points in GPSResults (with the default settings).

Why would 10 Hz data have more "problem points" with a high acceleration? Here are two possible causes:

  1. Noise and simple math: acceleration is speed difference divided by time. If we go from 5 Hz to 10 Hz, the   number we use for time goes down from 200 ms to 100 ms. To illustrate this, let's assume that we have a "noise peak" of 2 knots (1 m/s) between two points. At 5 Hz, this gives at acceleration of 5 m/s2; at 10 Hz, we get an acceleration of 10 m/s2 which would trigger the filter.
  2. Actual movement of the GPS: we have seen above that a speed difference of just 1 m/s is enough to trigger the filter if we measure at 10 Hz. That corresponds to just 10 cm (4 inches) of (extra) movement. With a GPS on top of a helmet, just having the head move suddenly when hitting a piece of chop could cause such an extra movement; similarly, the wrist might move when the rig is hit by a big gust.
Which one of these is the culprit? Well, if it's an actual movement, we should be able to measure it, right? How about using an accelerometer? Every smart phone has one, and there are plenty of apps on Google Play to read it and store the acceleration numbers. Unfortunately, that raises the next question - how good are the accelerometers in smart phones? 

Fortunately, the cold temperatures and lack of wind gave me time to play around a bit to get some answers. I'll switch to a question-and-answer format for the rest of the post to describe what I did.

Q: What were the questions?
  1. How does the accuracy of a smartphone accelerometer compare to the acceleration calculated from GPS speeds?
  2. Can we use a smartphone accelerometer to differentiate between random noise and actual movements in GPS data?
Q: What's the setup for the experiment to get answers?
The basic idea was to use a phone and a GPS in a controlled setting with regular acceleration changes, and to compare the data from the two devices. I used a pendulum setup: as the pendulum goes back and forth, it goes from zero speed to maximum speed at the center, and back to zero speed at the top on the other side. The changes are gradual and smooth, basically creating sinus curves for both speed and acceleration. Here's a picture of the setup I used:
It's a dustpan with a stick, and a plastic case to hold an Android phone (Samsung Galaxy J1) and a u-blox 8 / Openlog GPS prototype. The case is attached by velcro. I stepped out onto the balcony, held the stick at the top, and let everything swing back and forth, doing roughly a half circle (180 degrees) with every swing.

Q: How did you log the data?
The GPS was set to log at 10 Hz (NAV-PVT only), after letting it warm up for 20-30 minutes. On the Android phone, I installed the app "Sensor Record", and logged Accelerometer data at 10 Hz (100 ms delay). 

Q: How did you analyze the data?
I used software I wrote to read the GPS files, select the regions I wanted to use, and copy and paste the data into LibreOffice. I also copied and pasted the accelerometer data (from the .csv files the app made), and calculated a measure of total acceleration as:
a = sqrt(x*x + y*y + z*z) -9.81
where x, y, and z were the sensor reading for the three dimension, and 9.81 is the standard gravity (which the z sensor shows without movement if the phone is lying flat).
For the GPS data, acceleration was calculated as the difference in doppler speed to the previous point, and converted to m/s2. 
To align the data from the two devices, I used the time stamps as a rough start, then created a line graph, and deleted cells in one column to create the exact alignment.

Q: What are the results?
Let's start with a graph that shows the measured GPS speed and acceleration:
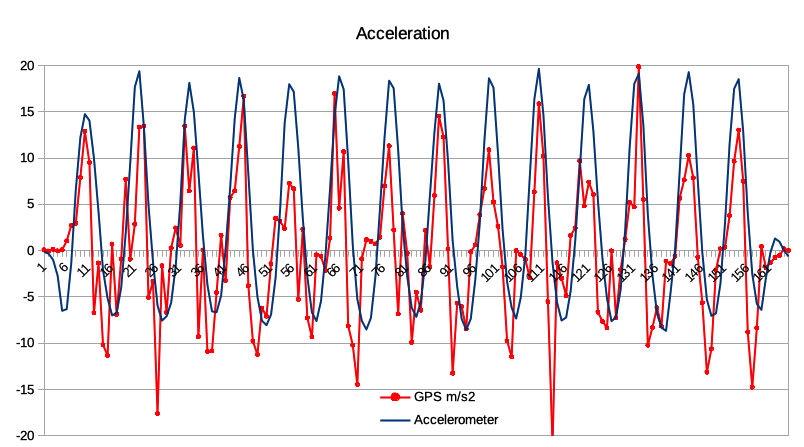
So this is roughly as expected, except that it's a bit noisy. All the movements and speeds were about the same, so all the peaks should be more similar than they are. The next graph compares the acceleration from the GPS (in red) to the acceleration from the phone accelerometer (in blue):

The acceleration measured by the phone was much smoother, and much closer to the actual motion of the pendulum (for a better look, check the first picture in this post, which is a plot of only the first section in this graph). So that's quite promising!

Basic physics tells us that the changes in speed for a pendulum should be smooth and continuous, generating a sinus curve. Therefore, changes in acceleration should also be smooth (remember that the derivate of a sinus curve still looks like a sinus curve, just offset a bit?). So let's look at the changes in measured acceleration in the accelerometer data:

The solid curve shows the changes in acceleration; the broken line shows the acceleration for comparison. You may notice that lines going down are a bit steeper than the lines going up - that's because I pushed the pendulum a bit from the right to the left so that the height would remain the same for every swing. 

Now let's look at the changes in acceleration in the GPS data - we'll just add a read line to the graph:
This is much more chaotic! All the extra spikes in the data are from random errors in the GPS speeds. They are just much easier to see in this graph (which is typical for second derivative graphs).

Q: What are the answers to the initial questions?
  1. How does the accuracy of a smartphone accelerometer compare to the acceleration calculated from GPS speeds? The smartphone accelerometer is much more accurate (at least in this test). That's no big surprise, since it was designed to measure acceleration, while GPS units are primarily designed to determine location.
  2. Can we use a smartphone accelerometer to differentiate between random noise and actual movements in GPS data? Yes, it seems that the smartphone accelerometer can be a useful tool to answer this question. Note that in this experiment, the GPS was a bit more challenged than when windsurfing, because it was done right next to a house, and because the GPS antenna changed its orientation to the sky by 180 degrees during each run, ending up sideways to the sky. 
Q: Why can't we just use accelerometers to calculate speed?
If the acceleration numbers are so accurate, it would seem logical that simply integrating them should give us speed numbers - would they not also be accurate? Only in theory (and perhaps in the absence of gravity .. but that's also a theoretical scenario). In practice and in the presence of gravity, we would have to know the exact orientation of the sensors at all times to calculate accurate speeds. Any small errors would quickly accumulate. According to a device manufacturer, even relatively small "angle error" of two degrees would lead to a velocity error of almost 2 knots within 10 seconds - much worse than what we can get from a GPS.

If you take a close look at the graphs above, you can see some obvious indications of the "angle problem". The graphs from the accelerometer acceleration has much higher positive than negative values. If we'd integrate that to get the final speed, we'd end up with a final speed in the 100 knot range! 

That is a result of the way I treated earth's gravity in the calculations, subtracting it after combining the three dimensions. Theoretically, gravity should be subtracted from the z-dimension before adding the acceleration vectors to calculate net acceleration. That's easy enough if the phone orientation is (a) known and (b) constant. But in the experiment above, the phone changed orientation relative to the earth: at the ends of the arcs, it was standing on its side, while in the middle, if was flat. So at the ends, the y-sensor would have measured gravity, while in the middle, it was the z-sensor; and in between, both of them at varying degrees. In theory, it would be possible to do a more accurate calculation by measuring the orientation at the points of zero speed, and calculating the intermediate positions; but that is rather complicated, and not required for this experiment.

Wednesday, November 7, 2018

Fun at the Slicks

More pictures, less words:
The forecast was 22 mph WSW, sunny, and warm. No surprise we got low 30s! We started sailing just before noon to catch the high tide at the Kennedy Slicks. GPS tracks:
Falcon 99, Loft RacingBlade 6.3, BP Weedspeed "38". Top speed (2 sec) 32.4 knots. My fastest 5x10 second average ever on a slalom board; I was faster only 3x on a 72 l speed board. Nina did freestyle, overpowered on 4.2. A bit too gusty there for freestyle, speed is more fun!

A video from one of the runs:

Sunday, November 4, 2018

Racing Lessons

One of the great things about racing is that it shows us where we need to improve. Sometimes, these are things that are not obvious during the typical back-and-forth sailing, but the prospect of more races in the future can motivate us to improve. In races that are mostly beam reach or slightly downwind, like the recent ECWF Hatteras races, jibes are very important. Here's a list of what to learn:
  1. Jibe dry on any equipment you may use in racing.
  2. Jibe dry in chop, with distractions, and at any spot - not just in nice flat water where nobody is near.
  3. Learn to adjust the radius in the middle of the jibe to avoid obstacles.
  4. Get back to full speed quickly after a jibe.
  5. Plane through jibes.
  6. Pick your jibe path so your competitors end up behind you.
Most of these points seem quite self-explanatory, perhaps even obvious. If you fall in a jibe, you'll loose a lot of ground. If you usually jibe dry, but never jibe around people or jibe marks, the distractions and extra chop may make you fall. If you're in the middle of the pack, you often have to adjust your jibe radius because a sailor in front of you crashes or comes to a dead stop. 

However, I had never realized the importance of #4 - getting back to full speed quickly after a jibe. I had often worked on #5, planing through a jibe. But whenever I come off the plane in a jibe, I'd usually take my time and wait for the next gust or swell to push me back up on a plane. On the second day of the ECWF races, when we had planing conditions for four races, I learned the error of my lazy ways ... 12 times in a row (in 4 races with 3 jibe marks). On the straights, I had at least similar, and often better, speed than the two guys (Andy and Keith) who finished ahead of me in most races. In the jibes, I came off the plane most of the time, but so did Keith. But it took me about 25 seconds to get back up to full speed, much longer than Keith, so he usually gained at least 100 meters at every jibe mark. 

I'm pretty sure Keith does not train much for races, so why did he get going so much faster? Perhaps the reason is that he usually sails in waves, which I (almost) never do. Wave sailing at Hatteras often includes a lot of slogging and pumping practice - be it to catch a wave, or to get enough speed to make it over the shore break. Lazy sailors get pummeled and don't catch waves! Nor do they get to beat wave sailors in races :-(.

Point #5, planing through jibes, is really just a logical consequence of #4. However, chances that you'll plane through a jibe in racing are always lower than in free sailing, since the jibe mark dictates where you jibe; other sailors create chop and may disturb the wind; and the jibe radius is often chosen to keep others at bay, or to sneak around them, which can make it hard to plane through the jibe. Even PWA slalom pros often don't plane through jibes! But you can always see them pump like crazy to get back up to speed.

The last point about picking your path is how Andy managed to win 2 of the 4 races, despite being on slower gear. Andy was usually third at the first jibe mark, but always had the highest approach, which allowed him to see where both Keith and I were jibing. He could then come in between and end up before us. At that point, it did not matter much if he planed through the jibe or not, since he blocking us. This approach requires quite a bit of experience, confidence, and skills - perhaps more experience than can be gained by attending one or two race events per year. Some of the top level slalom sailors now train slalom on Tenerife, with up to 20 races per day, often for several weeks in a row - that can amount to hundreds of training races! So I'll put this one on the back burner for now, and concentrate on regaining speed after a jibe. 


Saturday, November 3, 2018

Too Much

The forecast called for wind in the 30s (mph, that is). That's what we had when I started rigging - a 4.7, since the wind cannot be trusted. The 4.7 never got wet. Neither did the 4.0 that I rigged afterwards - I switched to the 3.4 Nina had rigged, since the wind had picked up:
I got onto the water when the wind averages where in the mid-40s, gusting into the mid-50s. I took advantage of this rare opportunity to sail in a lot of wind. A lot. Enough for the Red Bull Storm Chase. More than I had ever sailed in before. At one point, the averages where 49 mph, gusting to 59 mph. For those used to other units: 59 mph is 95 km/h, or 10 Beaufort - Windstärke 10, "Schwerer Sturm".
That was a bit too much for me, even on the 3.4. I pretty much had to waterstart in both straps; sailed out of the harness half of the time; had the sail barely sheeted in, and was nevertheless fully planing on my small FSW board. The wind was onshore, the tide was low, and I was wearing a helmet, so there never was any real danger. But the fun-factor was somewhat limited, and when gusts hit, I had a really hard time to keep the board on the water. Back on shore, it was not just blowing sand - it was blowing shells! Even getting the gear back to the parking lot safely was a 2-person job.

Usually, low tide and SW wind at Kalmus is flat and smooth, but not today. Eddie caught Nina trying a Shove It (when the wind was "only" around 25-40 mph):
A few minutes later, it looked a bit windier:
It still does not look that dramatic on the picture, but she came in a few minutes later, too overpowered on the 3.4. When the wind picked up a bit more in the next half hour, we had smoke on the water. At one point, I thought it was getting flatter again, because the wind was flattening out the little waves.

Well, finally getting a session on a 3.4 was all nice and good, but can we now please go back to being comfortably powered on 4.0 or larger?