I'm noise sensitive, so perhaps it is quite fitting that I spent some time looking at "noise" in GPS units, and the relation between noise and data rates. Between the relatively cold water around Cape Cod and Cape Cod's dubious distinction to be the hot spot for the Brazilian P.1 variant of the COVID virus, on-the-water testing will have to wait a while. So the tests I report here are all stationary tests.
One big advantage about stationary tests is that we know exactly what speed the GPS should report: 0.00. Everything else is an error. As Tom Chalko did with Locosys GPS units many years ago, we can use this to learn about the error characteristics of GPS chips. There's one little caveat about the directionality of speed in speedsurfing, and the non-directionality of measured speed when the actual speed is 0, but we can ignore this for now.
For this series of tests, I am using a Sparkfun Neo M9N GPS chip with an active ceramic antenna (25 x 25 x 2 mm from Geekstory on Amazon). I'm logging either via USB to the a Surface computer, or with the Openlog Artemis I described in my last post. Compared to the M9 chip with the onboard chip antenna I used before, the current combo gets a lot better reception.
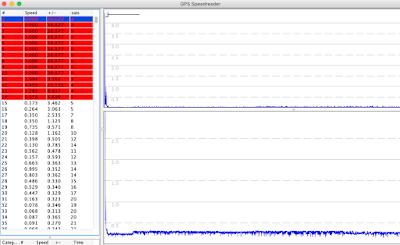
Let's start with an utterly boring test, where the GPS had a perfect, unobstructed view of the sky on a sunny day (the GPS was on top of the roof rack on our high roof Nissan NV van):
At the beginning, there's a little bit of speed when I switched the GPS on, and moved it to the top of the van. I had used the GPS just a few minutes earlier, so this was a "hot start" where the GPS very quickly found more than 20 satellites. After that, it recorded a speed close to zero (the graph on top), with an error estimate around 0.3 knots (the lower graph).Let's switch to a more interesting example. The next test was done inside, over a period of almost 2 hours. The GPS was positioned right next to a wide glass door, so it had a clear view in one direction. Here's the graph:
At three different times, the GPS recorded speeds of more than 1 knot, even though it was not moving at all. With a typical estimated accuracy of about +/- 0.5 knots for each point, that number is actually a bit lower than expected. But what raises some red flags is that each point with a speed above one knot is closely surrounded by several other points that are also much higher than average. This is reflected in the top speeds averaged over 2 and 10 seconds: 0.479 knots and 0.289 knots. In fact, all top 5 speeds over 10 seconds are near or above 0.2 knots.The GPS was at exactly the same spot for this test. The overall results is similar, with a bunch of spikes between 0.5 and 0.9 knots. The top results for 2 second and 10 second averages are a bit lower, but we still see a couple of 10 second "speeds" of 0.2 knots.
To have a closer look at the (non-)randomness of the observed errors, I copied the data from GPS Speedreader into a spreadsheet program, and then shuffled the observed speeds randomly. Next, I looked at all 2 second periods in the shuffled data, and compared the results to the results from the original data set. With completely random data, shuffling should not have an effect - we'd see the same top speeds. But if the original reported speeds (= errors) were not randomly distributed, we should see a difference. Here's a screen shot that shows the results for a test recorded at 18 Hz:
In my next post, I'll look into what's behind the non-randomness of the error. However, I'll leave you with a little puzzle and show the results of one of the tests I did:
Can you figure out what I did here? Here are a few hints: it involved a gallon plastic jug filled with water, and the numbers 2, 3, 5, and 30. Good luck, Sherlock!


