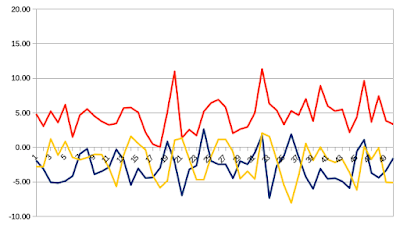
The red line shows the acceleration (the difference in speed from point to point). It's noisy! It all that shaking real? Well, I might have given the answer away in the title, but I owe you an explanation.
First the parts of the graph: it starts with a short break, then some walking into the water, some slogging, sailing through choppy water at about 22 knots, then in smooth water right next to the pier at 28-30 knots. A jibe is next, then back to the the start, pinching upwind. Note that the biggest acceleration changes are in the choppy approach to the wall.
I had my phone right below the GPS in an armband, and recording the acceleration data (at 10 Hz, just like the speed above):
This is a bit more confusing since we measure the three dimensions separately, and the phone changes orientation. But note that the overall pattern is quite similar to that from the GPS! Here are a couple of zooms:
I also had a GPS on the head, here's a comparison of the jibe region:
Note that we get a larger acceleration with the GPS on the arm - that right when I flipped the sail! The arm went forward first, reducing measured speed, and then back, increasing measure speed. The GPS picked that up nicely! The accelerometer peak at this region confirms that this is a real movement.
The head GPS has a smaller acceleration at this spot, but it's still above the 8 m/s2 filter threshold in GPSResults. With default settings, GPSResults would not give me an alpha for this run! Silly. If we measure at higher resolution, filters need to be adjusted accordingly!


